
Findings and Figures
Measuring Industrial Policy:
A Text-Based Approach
Réka Juhász, Nathan Lane, Emily Oehlsen, Verónica C. Pérez.
Below, we present the key takeaways from our research, along with the
data behind each figure.
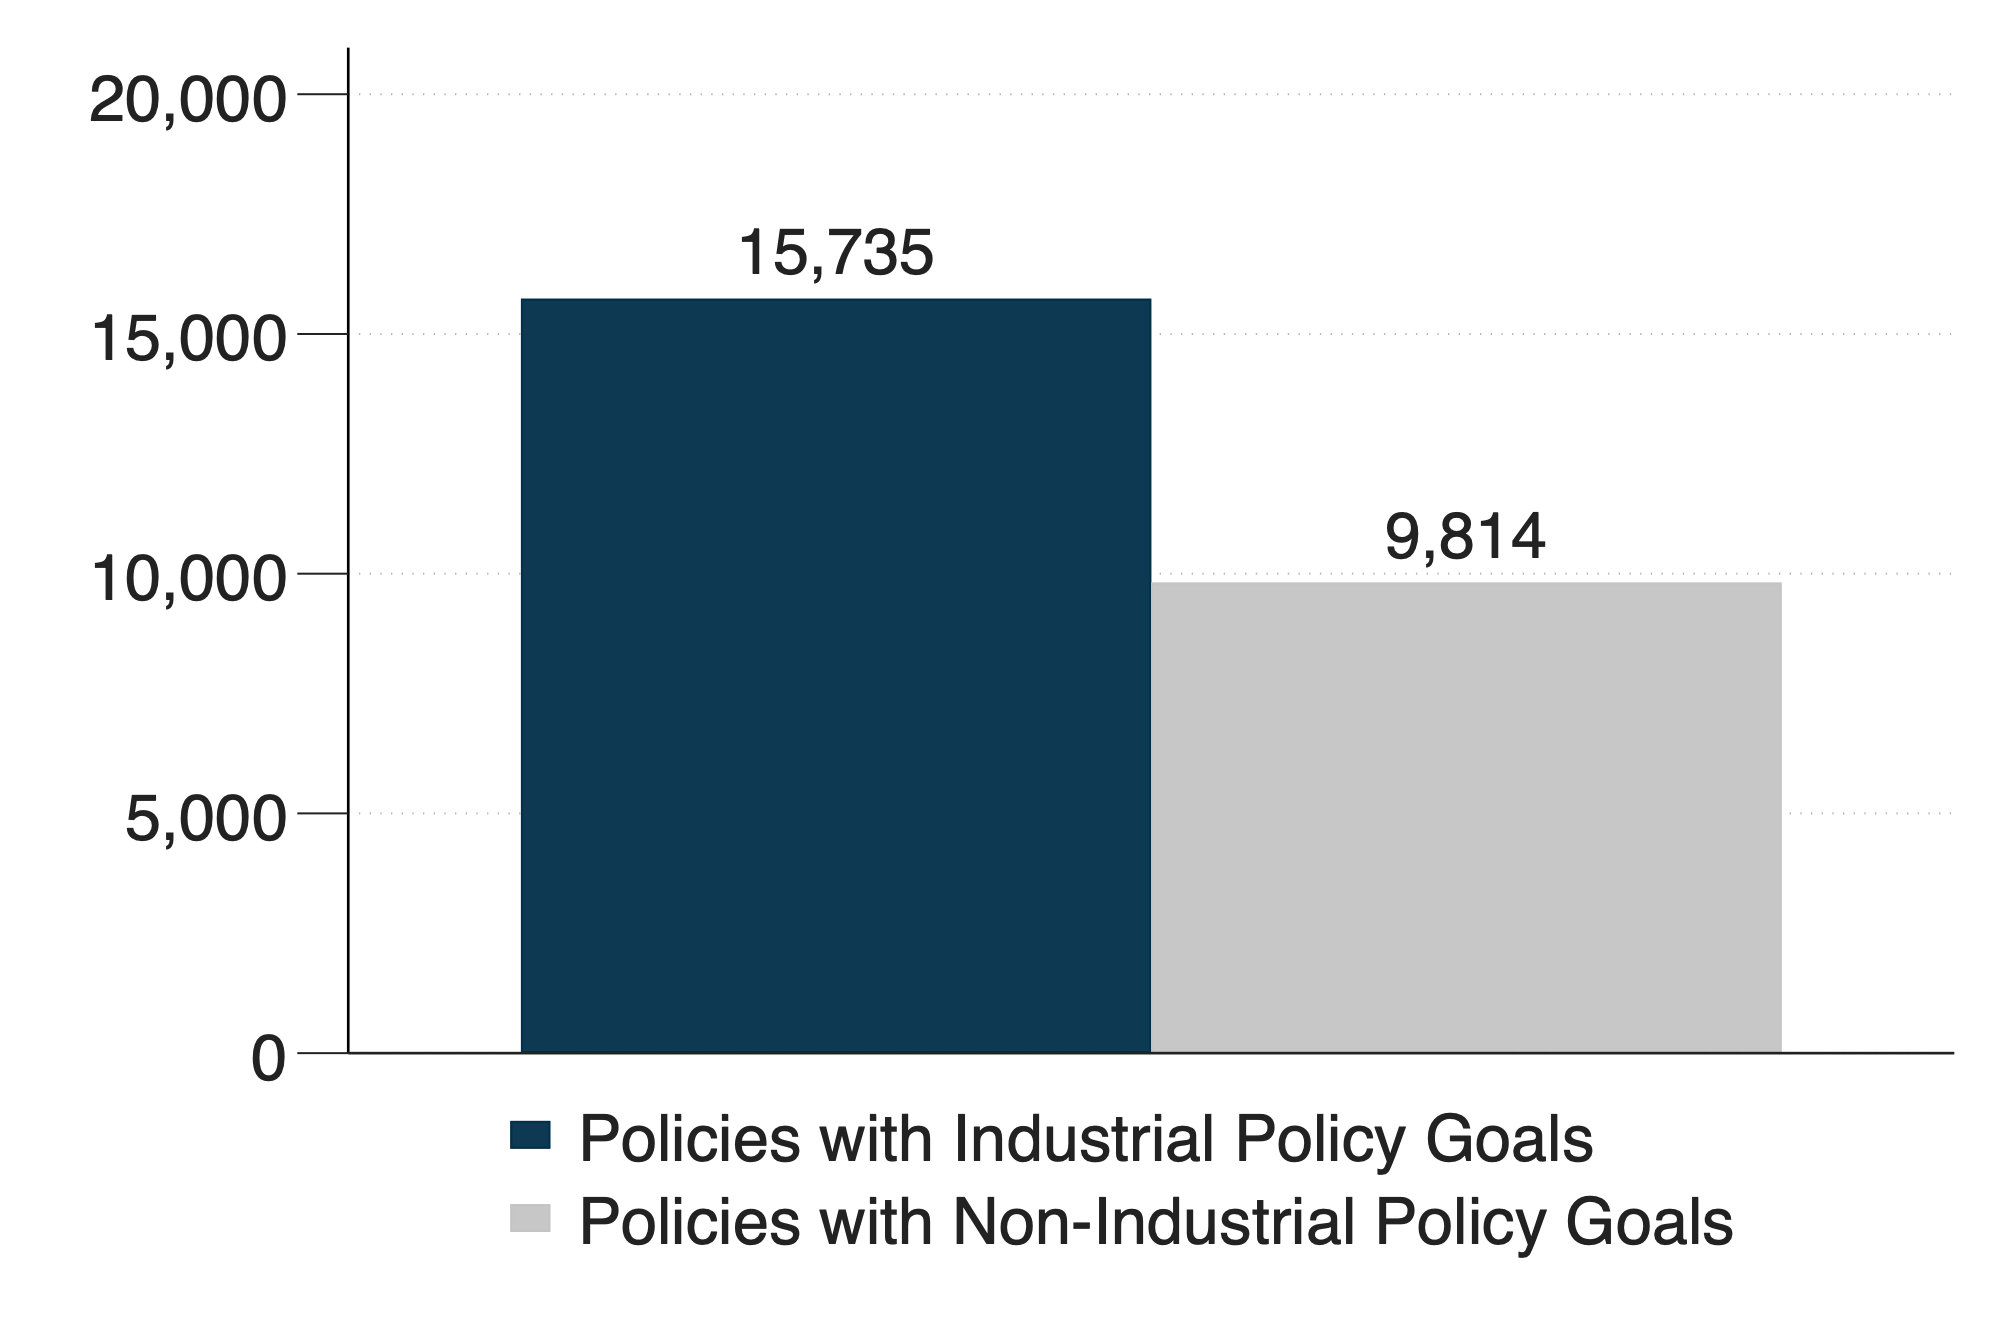
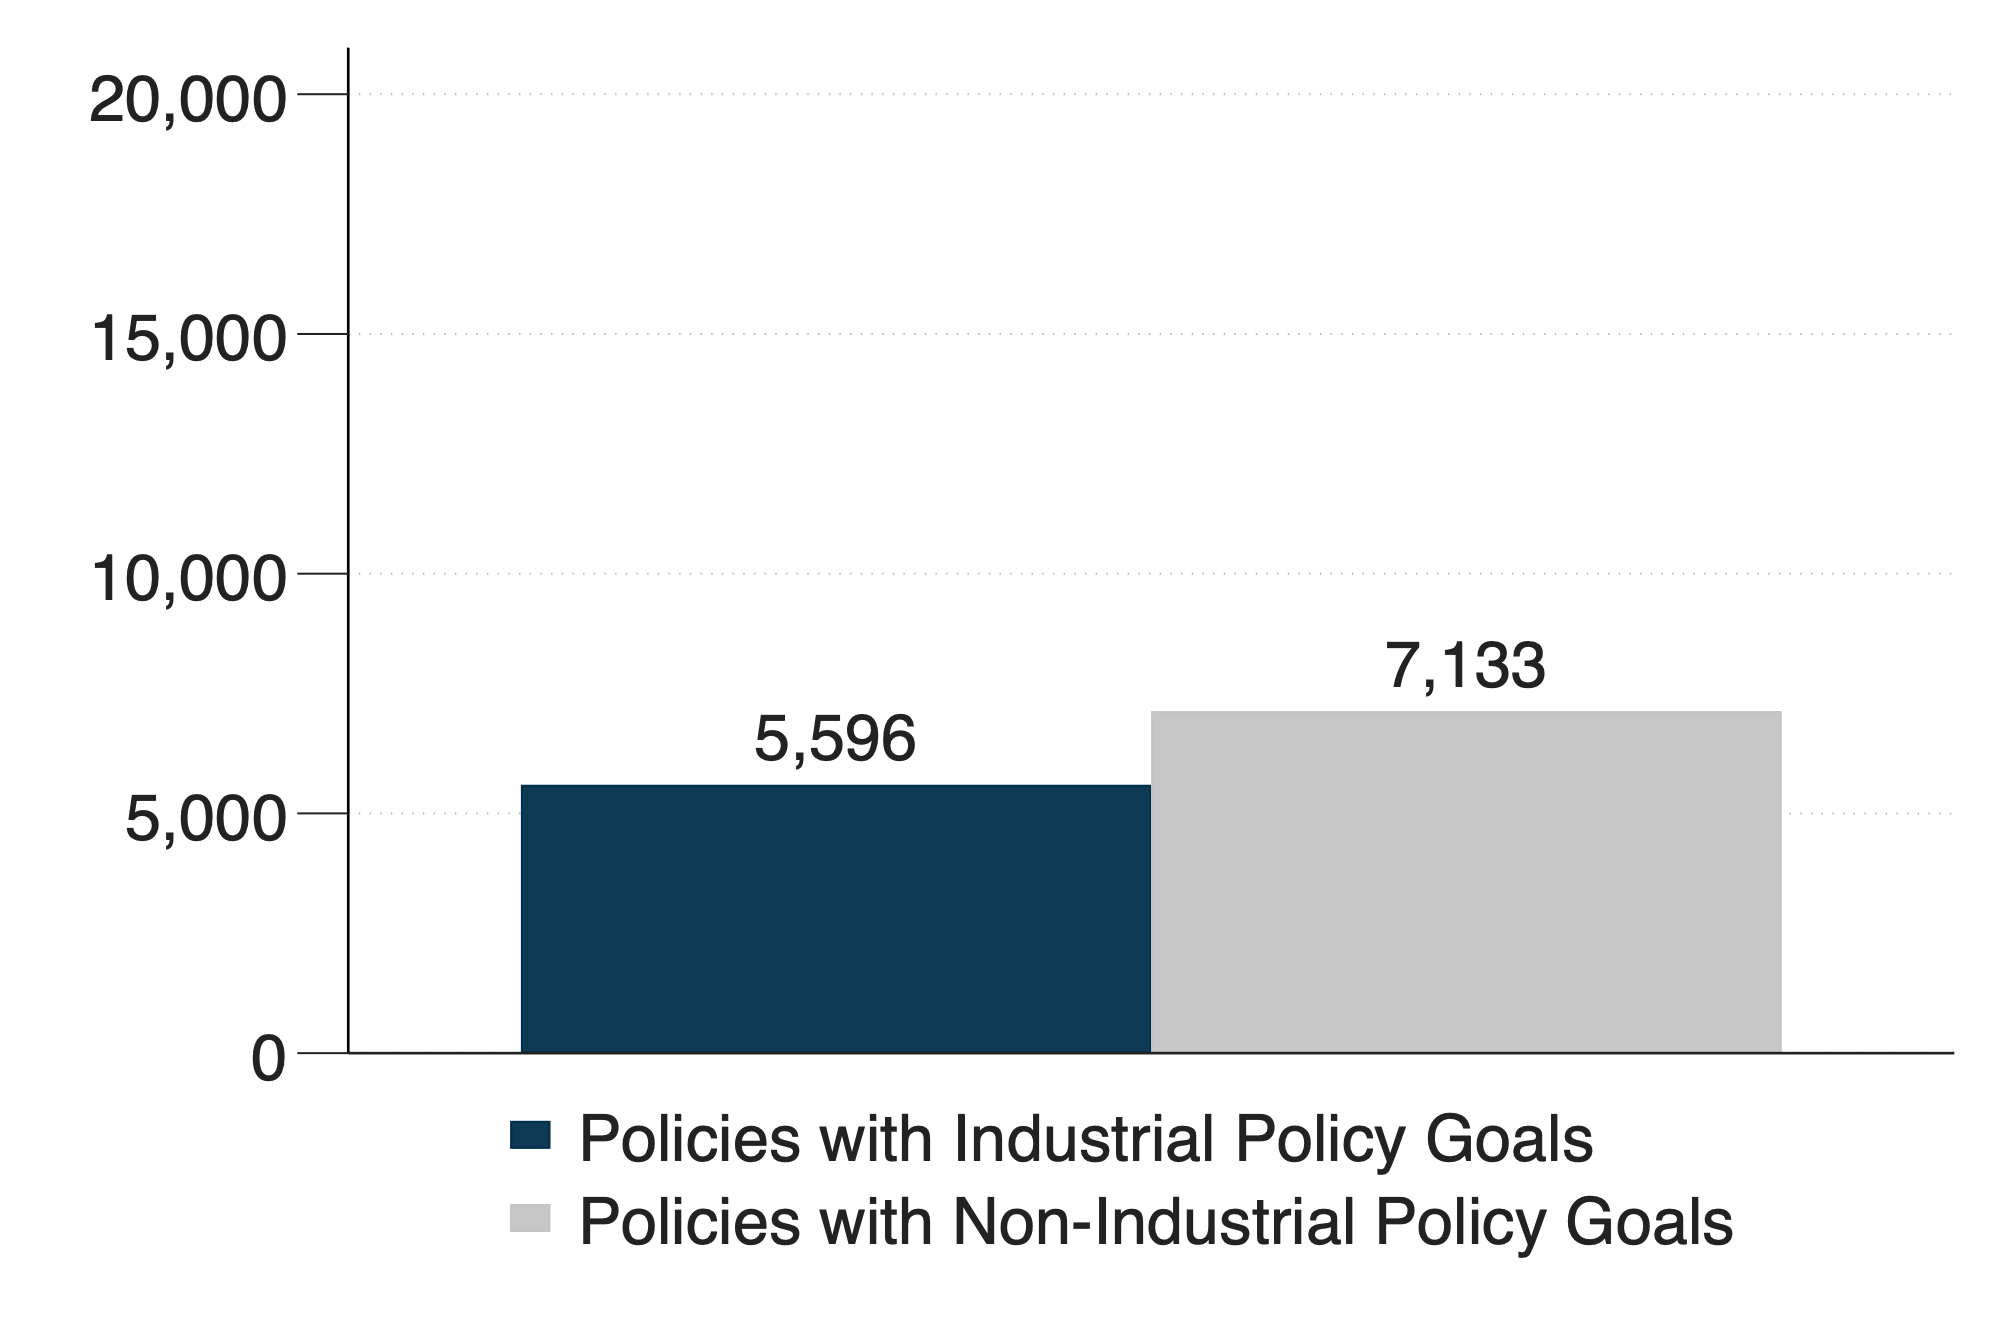
Figure 1. Model Classification of Policies with Identifiable Goals
(a) All Industrial Policies
(b) National Policies
Overview
In our research, we develop a text-based approach to industrial policy. We train and validate a Large Language Model (LLM), specifically a fine-tuned BERT model, to identify industrial policies using text from interventions in the Global Trade Alert (GTA) database (Evenett, 2019).
We start our workflow by defining industrial policy as deliberate government action aimed at altering the composition of the domestic economy to achieve a public goal.
Second, we manually label ~6% of our dataset (2,932 observations) into 3 categories: “Industrial Policy”, “Other Intention”, and “Not enough Information”.
Third, we train and validate our BERT model to identify industrial policy, achieving an average accuracy of 94.1%. Lastly, we deploy our best model to classify 47,283 policies in the period between 2010 and 2022.
Notes: Juhász et al. (2025). Policy classification from our fine-tuned BERT model. This exercise excludes policies with no identifiable policy goal (labeled as “Not Enough Information”). Panel (a) displays the simple aggregate counts from all policies in our sample. Panel (b) excludes firm-specific policies.
Fact 1
Industrial policy is important and on the rise.
Throughout our analysis we present: i) simple total counts of industrial policy activity; ii) national policy counts (excluding policies implemented at the firm level); and iii) counts of the implementing public entity using data on the institutions deploying industrial policies, from Juhász and Lane (2004) and Field (2024). The baseline measure (i) might be difficult to compare across countries if policies are reported at different levels of granularity. The second (ii) and third (iii) measures address these issues.
Our first result is that Industrial Policy is important. Figure 1 illustrates the classification results obtained from our BERT model. As seen in the figure, 44-62% of the policies with identifiable goals in our dataset are industrial policy.
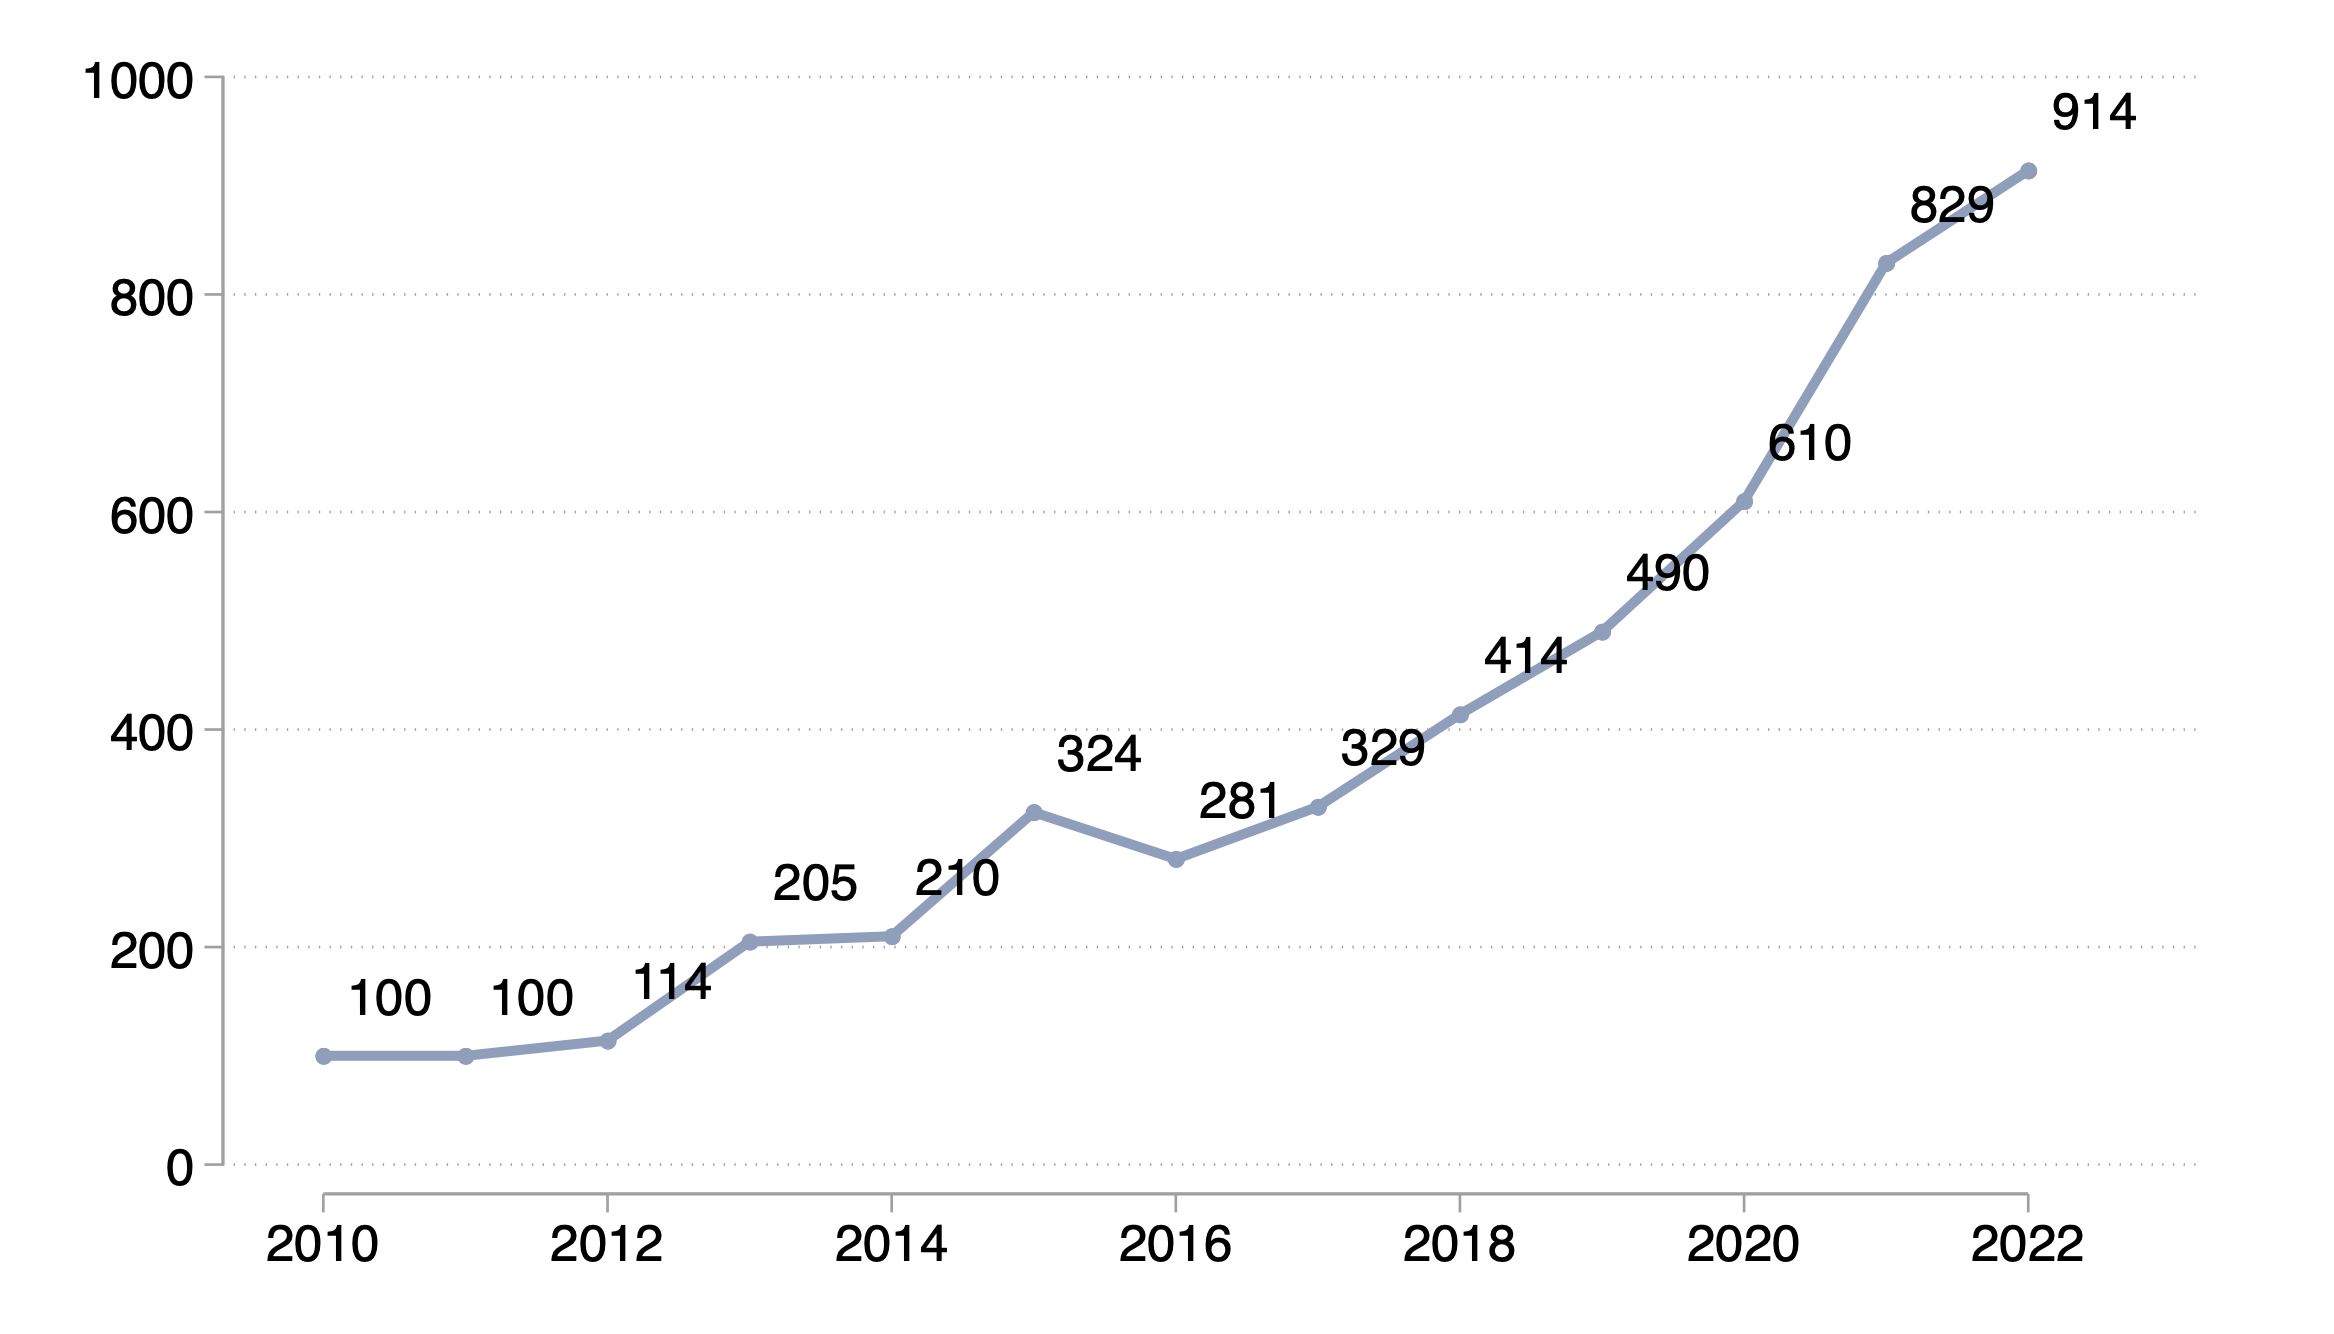
Our results also indicate that Industrial policy is on the rise. Figure 2 presents a time trend for industrial policy. We use the value in 2010 as a baseline (indexed to 100). Panel (a) shows that the count of all industrial policies implemented between 2010 and 2022 has increased more than thirtyfold. In panel (b), we focus on National-level industrial policy activity. We exclude policies aimed at specific firms. Here we can see that Industrial Policy activity increased fifteenfold. These results indicate that the GTA is not merely capturing policies at a more granular level over time.
Lastly, in panel (c), we count unique implementing agencies each year. As we can see, in 2022, the number of public agencies announcing at least one new industrial policy worldwide was nearly an order of magnitude higher than in 2010.
Note on Figure 2: Juhász et al. (2025). This figure illustrates the time trend of industrial policy from 2010 to 2022. We follow GTA guidance and use only policies recorded by the GTA in the same year that they were announced for this exercise. The figure is presented as an index with the year 2010 set as the base year (indexed to 100). Panel (a) shows all industrial policies, panel (b) shows policies that are directed at specific firms, and panel (c) shows the entities implementing industrial policy.
Figure 2. Time Trend of Industrial Policy Activity

(a) All Industrial Policies

(b) National Policies
(c) Distinct Entities Implementing Industrial Policies
Fact 2
Contemporary industrial policy typically uses
export-related measures and subsidies.
Rarely import tariffs.
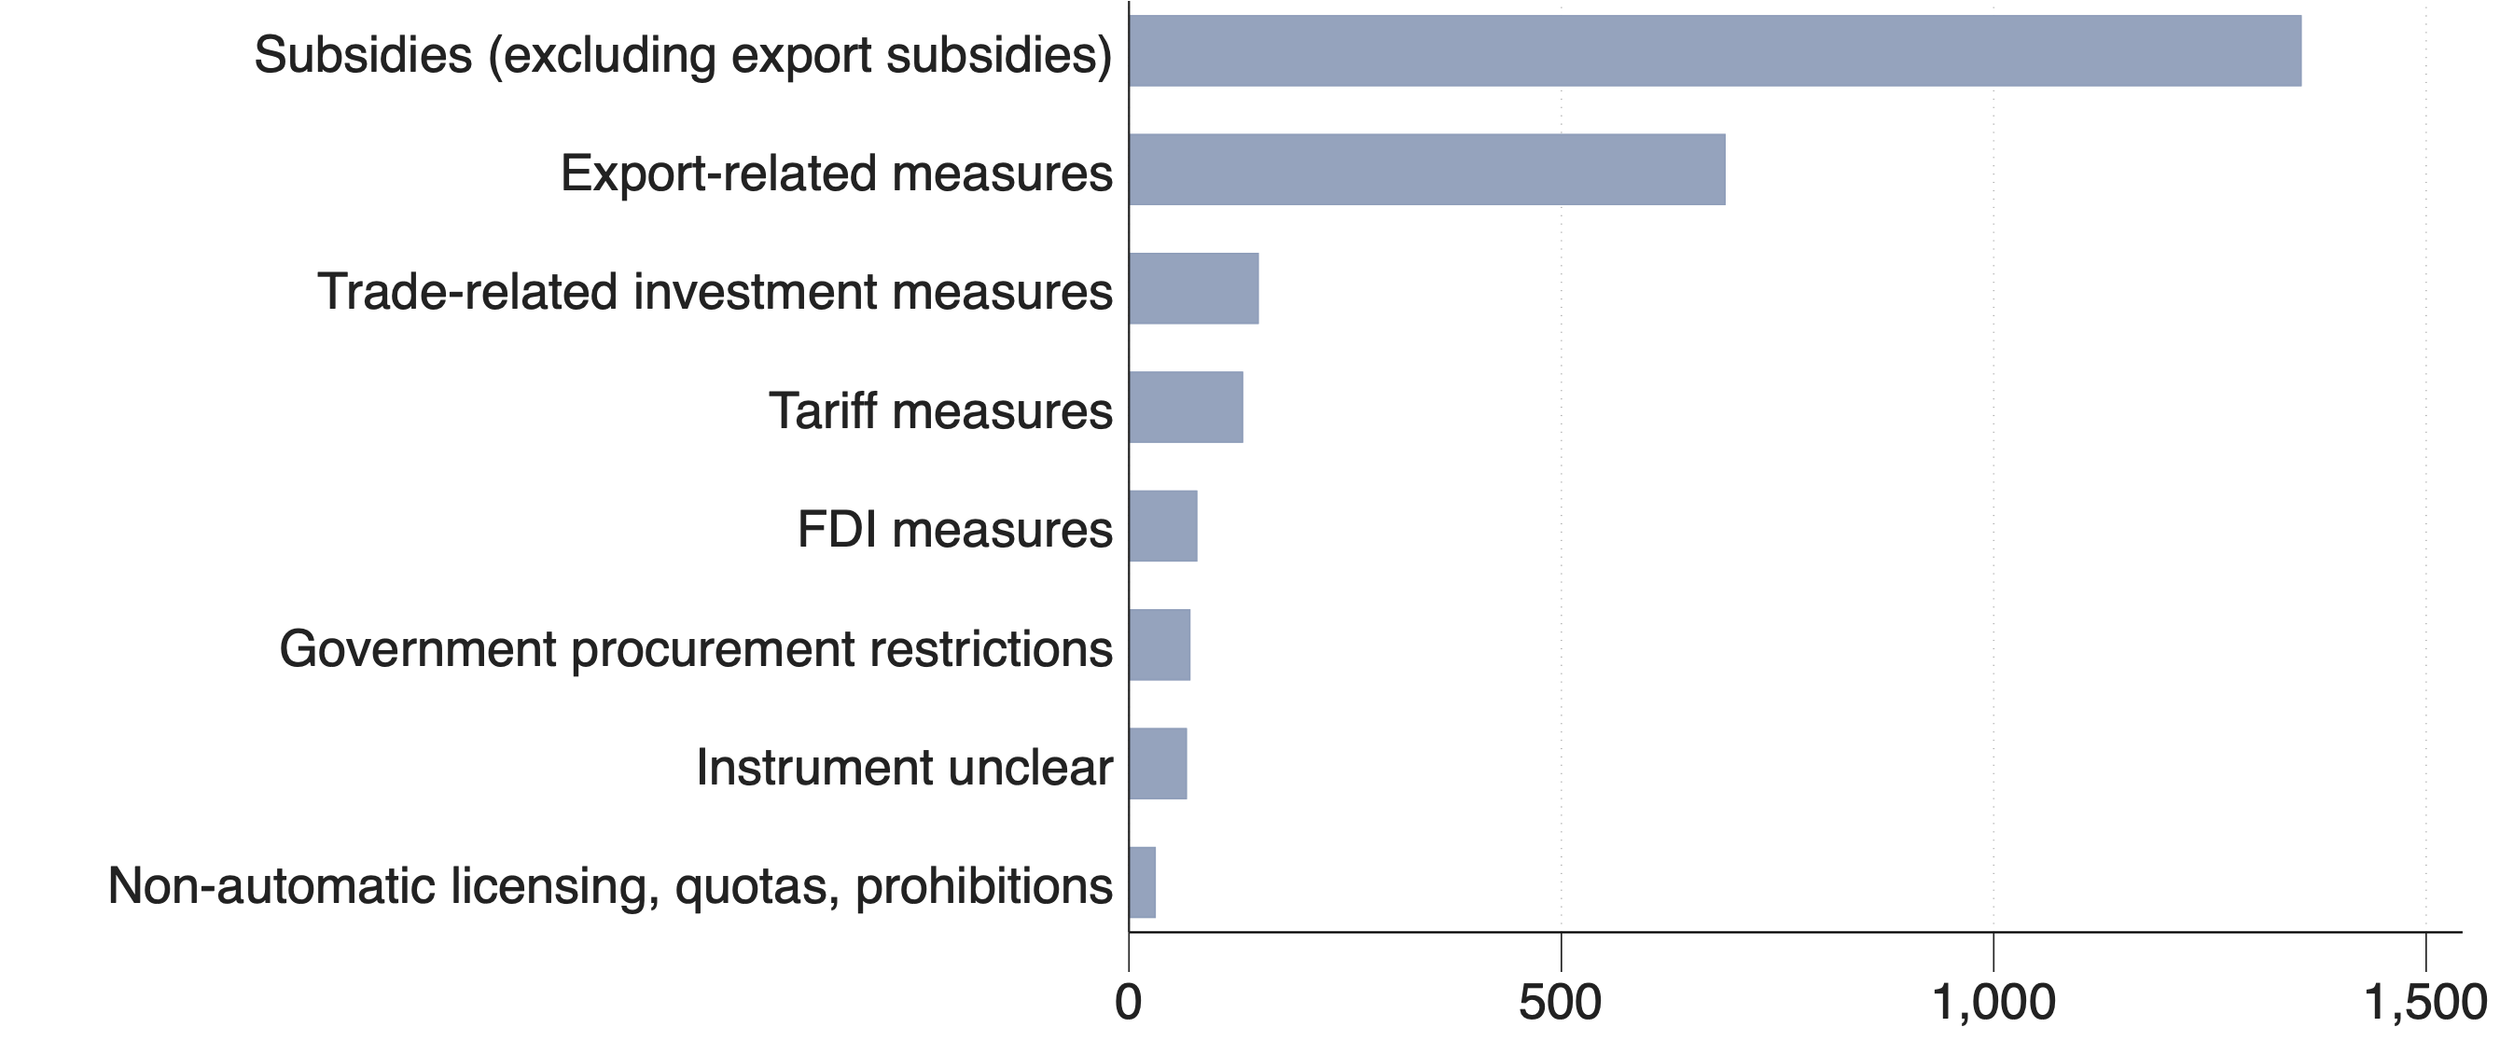
Figure 3. The Instruments of Industrial Policy
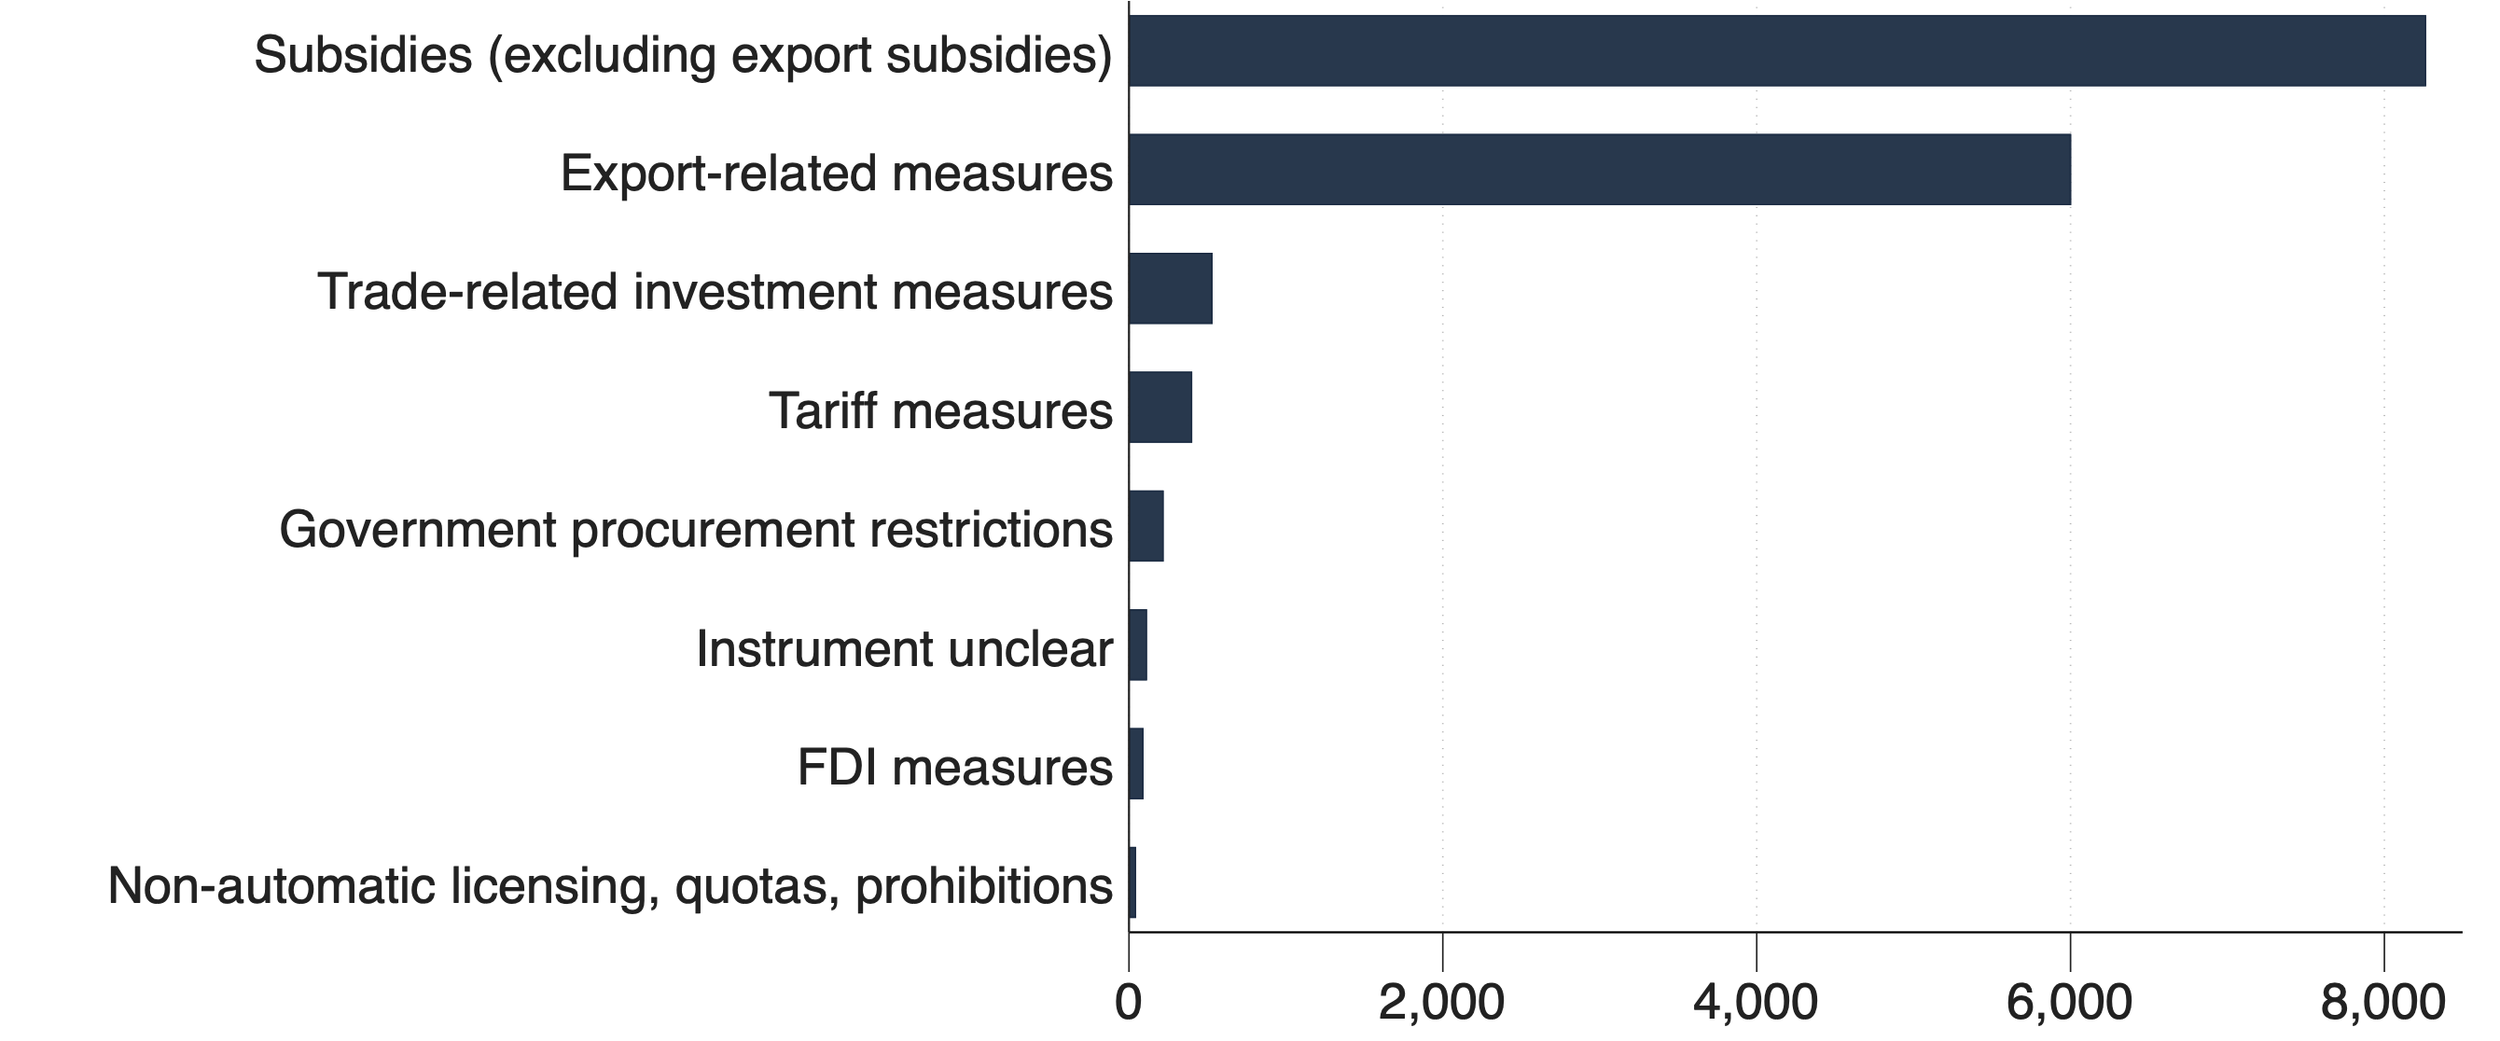
(a) All Industrial Policies

(b) National Policies
(c) Entity-Policy Instrument Pairs
Our second finding is that contemporary Industrial Policy is typically deployed using subsidies and export-related measures. Figure 3 shows the aggregate counts of the interventions we classify as industrial policy, disaggregated by UNCTAD’s MAST Group. As shown in the figure, subsidies and export-related measures (e.g., trade financing) account for the majority of contemporary industrial policy activities.
Notably, IP activity deployed via subsidies and export-related measures is close to an order of magnitude more common than import tariffs, even based on our most conservative estimates. Specifically, panels (b) (national policies) and (c) (implementing agency) address the concern that our count-based measure of IP activity may overstate the importance of measures such as subsidies relative to tariffs, as the former may be reported at a more granular, firm-level of implementation.
Our findings contrast with long-held assertions regarding industrial policy. First, tariffs provide an incomplete picture of industrial policy, as most tariff measures do not appear to be used for IP goals. Second, while tariffs were more commonly used for IP goals in earlier periods, contemporary industrial policy is not protectionist. To the contrary, much industrial policy seems designed to facilitate participation in export markets. Ultimately, our findings underscore that modern industrial policy necessitates substantial fiscal resources and a high level of administrative capacity. States need sufficient fiscal revenue to subsidize firms and promote exports. These dimensions of state capacity provide crucial context for interpreting our next stylized fact.
Note on Figure 3: Juhász et al. (2025). The charts show the top eight most-used policy instruments by all the measures. We do not include more because the amount of IP activity is so small as to be hardly visible. The top eight most-used policy instruments by each measure of IP activity are the same, and the excluded policy instruments are the same for each measure of IP activity, too. The excluded MAST chapter codes are: Price-control measures, Migration measures, Capital control measures, Finance measures, Intellectual property, Contingent trade-protective measures.
Fact 3
Industrial policy is heavily used by
high-income economies.

Figure 4. Industrial Policy Activity by Income Level
Our third finding is that there is a strong positive correlation between industrial policy activity and income levels. Figure 4 plots the distribution of industrial policy by income quintile. Our results show that countries in the top income quintile deploy five to fifteen times as many industrial policies as countries in the lowest income quintile.
Note on Figure 4: Juhász et al. (2025). We divided all countries in our data into income quintiles based on 2010 GDP per capita (in Constant 2015 USD) data from the World Bank. Higher quintile means higher income. We present a simple aggregate sum of all the policies classified as industrial policies by our BERT model.
Figure 5. Regressions of Industrial Policy Activity on Income Quintiles

(a) All Industrial Policies

(b) National Policies
(c) Entities Implementing Industrial Policies

We formally examine the relationship between industrial policy activity and income by running a regression of a country's (log) total number of industrial policies on a set of binary indicator variables that denote the income quintile of each country in our dataset.
Figure 5 plots the resulting coefficients for each income quintile. This formal test shows that higher income quintiles are associated with greater use of industrial policy. Our coefficient of interest is large, and the difference is statistically significant for the fourth and fifth income quintiles, representing high-income countries. The baseline estimates (with no controls) suggest that total IP activity in the fourth and fifth income quintiles is 500-2000% greater than in the poorest income quintile.
Our results are robust to controlling for the size of the country, the number of exported products (to approximate the diversification of the economy), and the total number of observed policies (although the point estimates shrink in magnitude).
The regression results suggest that different reporting standards are unlikely to account for the patterns, as they hold across all three different measures of IP activity (Panels a-c).
Note on Figure 5: We regress the log of measures of IP activity on income quintiles, with the first quintile being the excluded category. We split all countries in our data into income quintiles based on 2010 GDP per capita data from the World Bank. Data on the 2010 population comes from the World Bank. Data on the number of HS6 sector codes traded by each country comes from COMTRADE.
Fact 4
Industrial policy is correlated with revealed comparative advantage in high-income economies
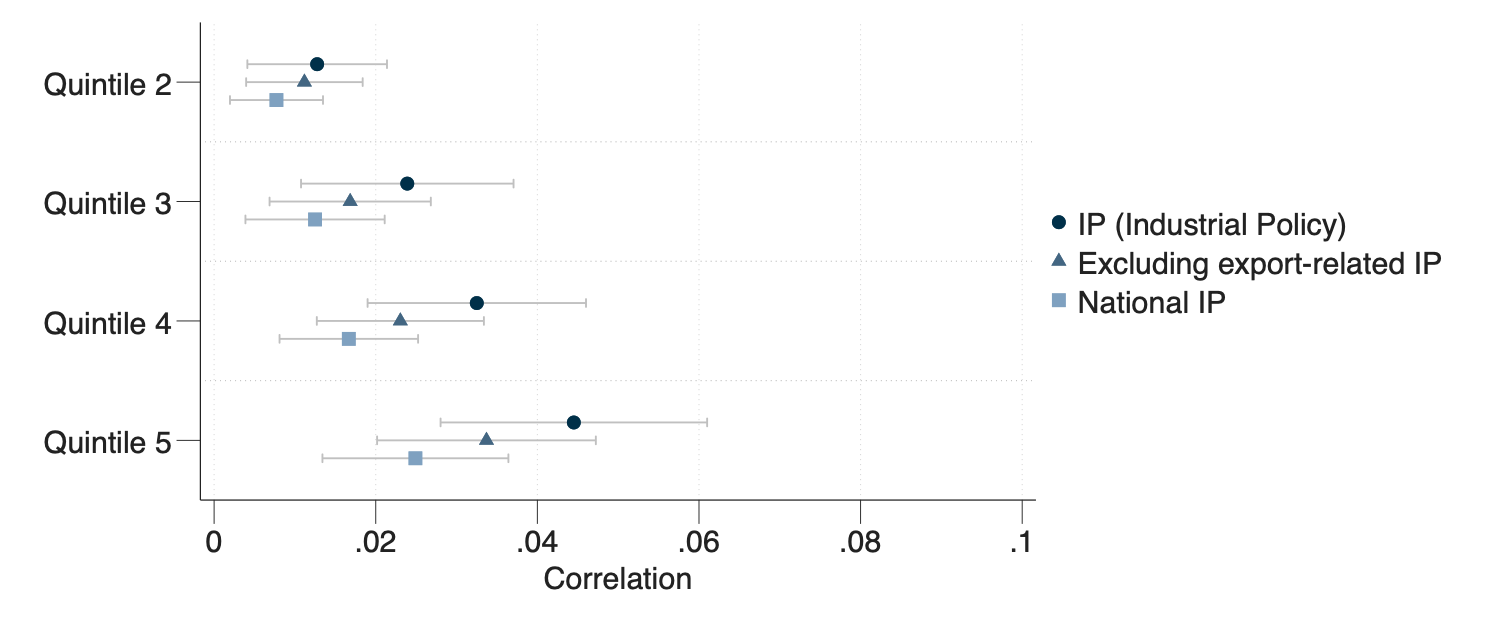
Our fourth fact examines the types of industries targeted by new industrial policy activity. We explore this by studying the relationship between our measures of industrial policy and the country’s revealed comparative advantage (RCA) by sector. Our findings suggest that sectors with higher RCA are more likely to receive new industrial policy interventions.
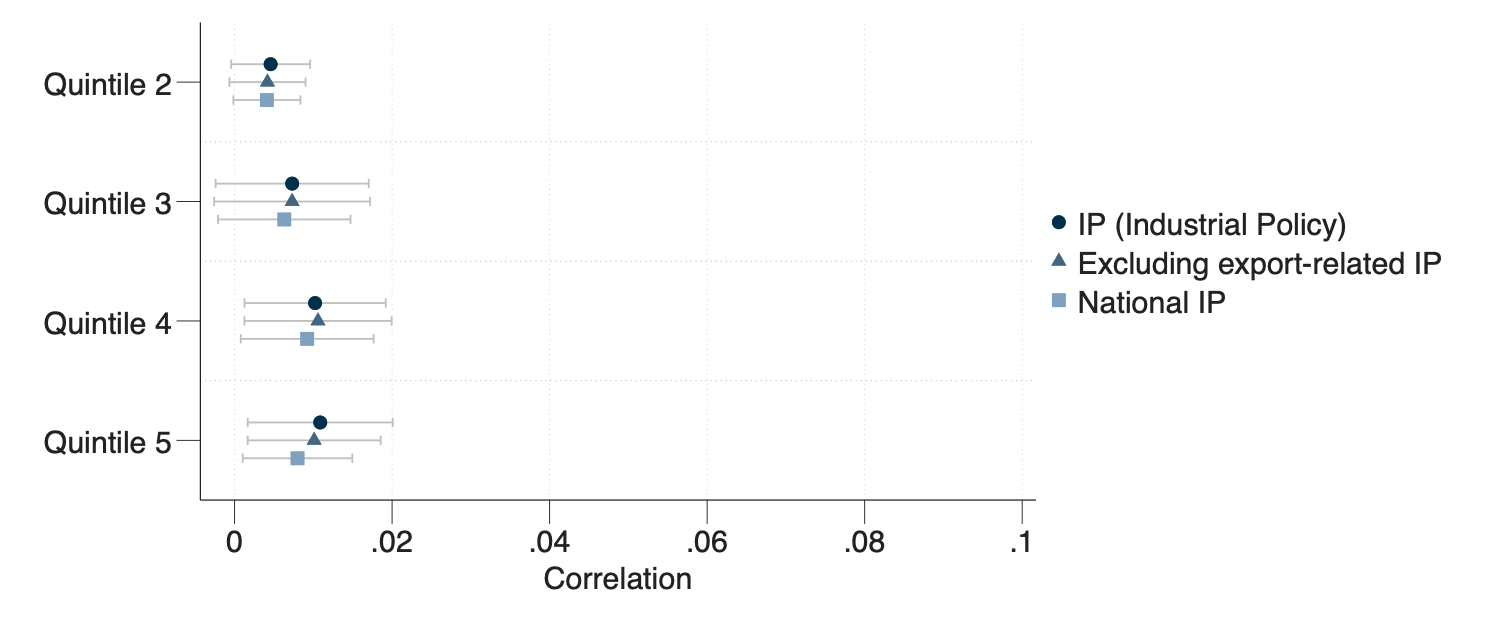
We also study targeting heterogeneity depending on income levels. We regress a binary indicator of industrial policy activity, in a given sector, year, and country, on a given country’s quintile distribution of RCA. Figure 6 shows the results of these estimations. For high-income countries (Panel a), we see a strongly increasing monotonic relationship between a sector's position in the RCA distribution and the probability of receiving a new industrial policy. Panels (b) and (c) show there is no similar effect for low- and middle-income countries. Therefore, our results indicate that industrial policy is correlated with revealed comparative advantage in high-income economies.
Note on Figure 6: We regress an indicator of industrial policy that takes the value of one if the HS (2-digit) sector k, country c, and year t, has at least one new industrial policy announcement. The independent variable takes the value of one if RCA is in quintile i of country c's distribution of Revealed Comparative Advantage in year t. All regressions include country-year fixed effects and cluster standard errors by country. The omitted category is the lowest quintile of the RCA distribution. Income data uses World Bank GDP per capita in 2010 (USD constant 2015). High income refers to quintiles 4 and 5. Middle income refers to quintile 3. Low-income refers to quintiles 1 and 2.
Figure 6. Regression of Sectoral Industrial Policy Activity by Income Levels and Revealed Comparative Advantage
(a) High-Income Countries
(b) Middle-Income Countries
(c) Low-Income Countries

References
Evenett, Simon J, “Protectionism, State Discrimination, and International Business Since the Onset of the Global Financial Crisis,” Journal of International Business Policy, 2019, 2(1), 9–36.